篇首语:本文由编程笔记#小编为大家整理,主要介绍了python-pyecharts 数据分析原来可以这么炫酷相关的知识,希望对你有一定的参考价值。
“ pyecharts 数据分析原来可以这么炫酷”

Echarts 是一个由百度开源的数据可视化,凭借着良好的交互性,精巧的图表设计,得到了众多开发者的认可。而 Python 是一门富有表达力的语言,很适合用于数据处理。当数据分析遇上数据可视化时,pyecharts 诞生了。
目录
1、特性
2、安装
3、最简单的图表
4、3d柱状图
5、k线图
6、仪表盘
7、地理坐标图
8、关系图
9、水球图
10、3d地图
11、饼图
12、雷达图
13、树图
简洁的 API 设计,使用如丝滑般流畅,支持链式调用
囊括了 30+ 种常见图表,应有尽有
支持主流 Notebook 环境,Jupyter Notebook 和 JupyterLab
可轻松集成至 Flask,Django 等主流 Web 框架
高度灵活的配置项,可轻松搭配出精美的图表
详细的文档和示例,帮助开发者更快的上手项目
多达 400+ 地图文件以及原生的百度地图,为地理数据可视化提供强有力的支持
先来安装我们需要使用到的模块。
pip install pyecharts
成功安装,我们一起来开发一个最简单的图表。
from pyecharts.charts import Bar
bar = Bar()#实例化柱状图
bar.add_xaxis(["衬衫", "羊毛衫", "雪纺衫", "裤子", "高跟鞋", "袜子"])#添加横坐标
bar.add_yaxis("商家A", [5, 20, 36, 10, 75, 90])#添加统计数据
#bar.add_yaxis("商家", [5, 20, 36, 10, 75, 90])#添加多个统计数据
# render 会生成本地 html 文件,默认会在当前目录生成 render.html 文件
# 也可以传入路径参数,如 bar.render("mycharts.html")
bar.render()
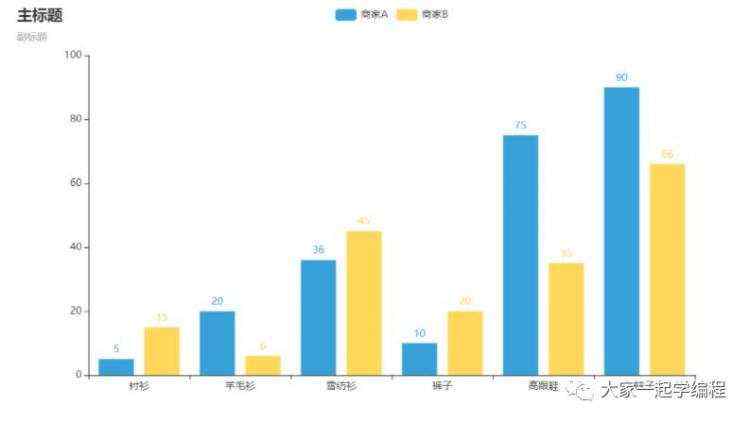
上面是最基本的统计图,柱状图,那我们来看一下3d柱状图。
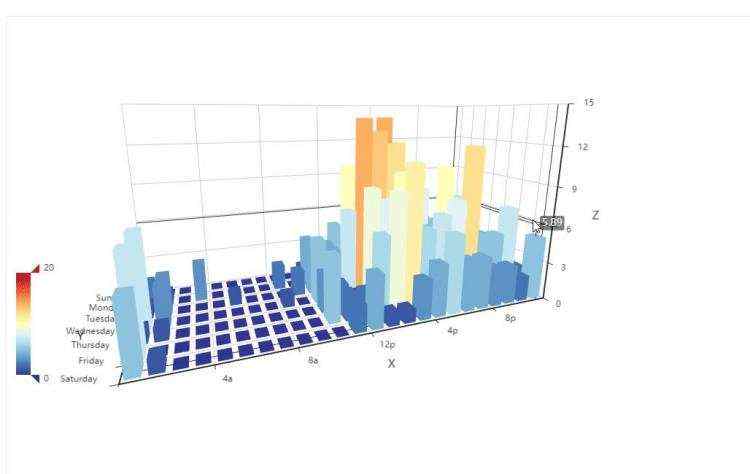
import random
from pyecharts import options as opts
from pyecharts.charts import Bar3D
from pyecharts.faker import Faker
data = [(i, j, random.randint(0, 12)) for i in range(6) for j in range(24)]
c = (
Bar3D()
.add(
"",
[[d[1], d[0], d[2]] for d in data],
xaxis3d_opts=opts.Axis3DOpts(Faker.clock, type_="category"),
yaxis3d_opts=opts.Axis3DOpts(Faker.week_en, type_="category"),
zaxis3d_opts=opts.Axis3DOpts(type_="value"),
)
.set_global_opts(
visualmap_opts=opts.VisualMapOpts(max_=20),
title_opts=opts.TitleOpts(title="Bar3D-基本示例"),
)
.render("bar3d_base.html")
)
以及一些炒股人士使用到的k线图。
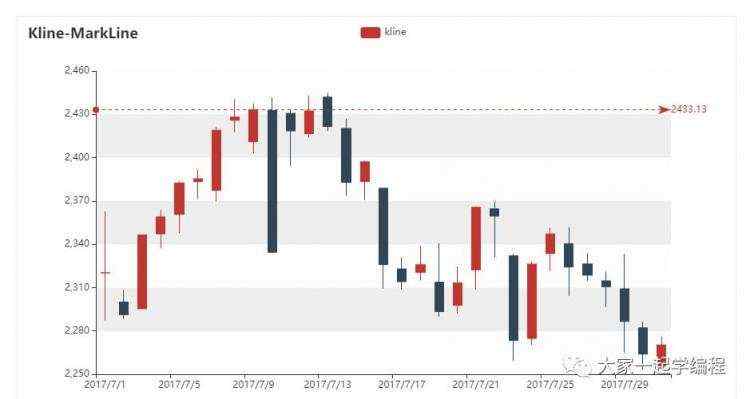
from pyecharts import options as opts
from pyecharts.charts import Kline
data = [
[2320.26, 2320.26, 2287.3, 2362.94],
[2300, 2291.3, 2288.26, 2308.38],
[2295.35, 2346.5, 2295.35, 2345.92],
[2347.22, 2358.98, 2337.35, 2363.8],
[2360.75, 2382.48, 2347.89, 2383.76],
[2383.43, 2385.42, 2371.23, 2391.82],
[2377.41, 2419.02, 2369.57, 2421.15],
[2425.92, 2428.15, 2417.58, 2440.38],
[2411, 2433.13, 2403.3, 2437.42],
[2432.68, 2334.48, 2427.7, 2441.73],
[2430.69, 2418.53, 2394.22, 2433.89],
[2416.62, 2432.4, 2414.4, 2443.03],
[2441.91, 2421.56, 2418.43, 2444.8],
[2420.26, 2382.91, 2373.53, 2427.07],
[2383.49, 2397.18, 2370.61, 2397.94],
[2378.82, 2325.95, 2309.17, 2378.82],
[2322.94, 2314.16, 2308.76, 2330.88],
[2320.62, 2325.82, 2315.01, 2338.78],
[2313.74, 2293.34, 2289.89, 2340.71],
[2297.77, 2313.22, 2292.03, 2324.63],
[2322.32, 2365.59, 2308.92, 2366.16],
[2364.54, 2359.51, 2330.86, 2369.65],
[2332.08, 2273.4, 2259.25, 2333.54],
[2274.81, 2326.31, 2270.1, 2328.14],
[2333.61, 2347.18, 2321.6, 2351.44],
[2340.44, 2324.29, 2304.27, 2352.02],
[2326.42, 2318.61, 2314.59, 2333.67],
[2314.68, 2310.59, 2296.58, 2320.96],
[2309.16, 2286.6, 2264.83, 2333.29],
[2282.17, 2263.97, 2253.25, 2286.33],
[2255.77, 2270.28, 2253.31, 2276.22],
]
c = (
Kline()
.add_xaxis(["2017/7/".format(i + 1) for i in range(31)])
.add_yaxis(
"kline",
data,
markline_opts=opts.MarkLineOpts(
data=[opts.MarkLineItem(type_="max", value_dim="close")]
),
)
.set_global_opts(
xaxis_opts=opts.AxisOpts(is_scale=True),
yaxis_opts=opts.AxisOpts(
is_scale=True,
splitarea_opts=opts.SplitAreaOpts(
is_show=True, areastyle_opts=opts.AreaStyleOpts(opacity=1)
),
),
title_opts=opts.TitleOpts(title="Kline-MarkLine"),
)
.render("kline_markline.html")
)
仪表盘,完成情况等使用
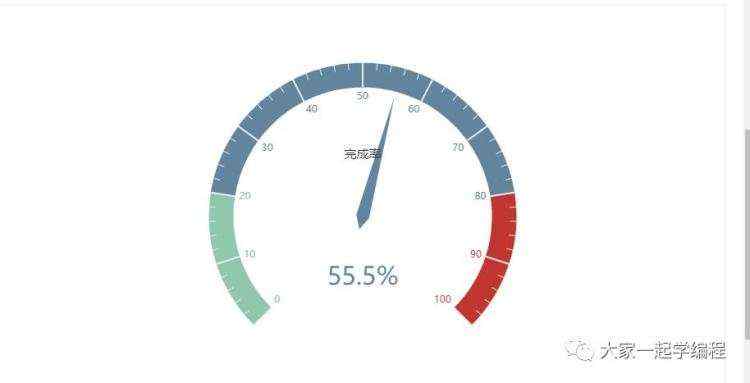
import pyecharts.options as opts
from pyecharts.charts import Gauge
"""
Gallery 使用 pyecharts 1.1.0
参考地址: https://echarts.apache.org/examples/editor.html?c=gauge
目前无法实现的功能:
1、暂无
"""
(
Gauge(init_opts=opts.InitOpts(width="1600px", height="800px"))
.add(series_name="业务指标", data_pair=[["完成率", 55.5]])
.set_global_opts(
legend_opts=opts.LegendOpts(is_show=False),
tooltip_opts=opts.TooltipOpts(is_show=True, formatter="a
b : c%"),
)
.render("gauge.html")
)
统计地理位置时使用。
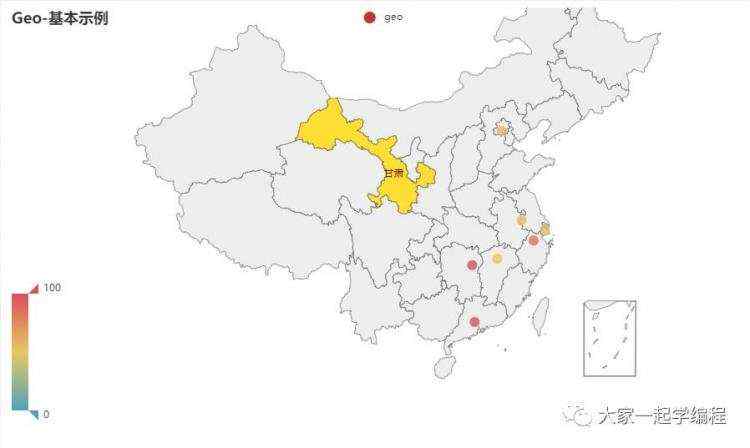
from pyecharts import options as opts
from pyecharts.charts import Geo
from pyecharts.faker import Faker
c = (
    Geo()
    .add_schema(maptype="china")
    .add("geo", [list(z) for z in zip(Faker.provinces, Faker.values())])
    .set_series_opts(label_opts=opts.LabelOpts(is_show=False))
    .set_global_opts(
        visualmap_opts=opts.VisualMapOpts(), title_opts=opts.TitleOpts(title="Geo-基本示例")
    )
    .render("geo_base.html")
)
关系图,每一个人的关系,看起来就像是一个星座一样。
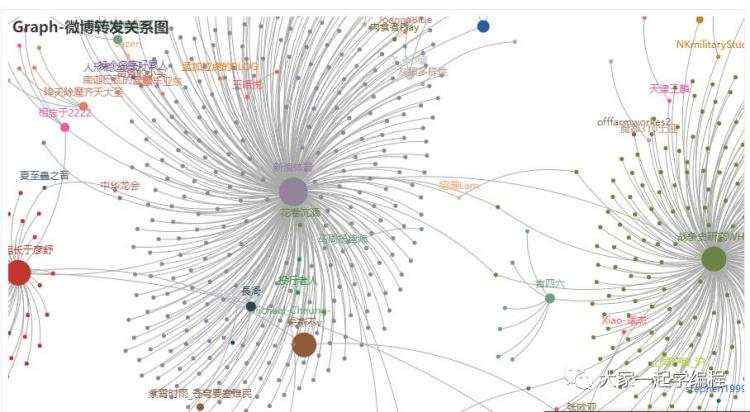
import json
from pyecharts import options as opts
from pyecharts.charts import Graph
with open("weibo.json", "r", encoding="utf-8") as f:
    j = json.load(f)
    nodes, links, categories, cont, mid, userl = j
c = (
    Graph()
    .add(
        "",
        nodes,
        links,
        categories,
        repulsion=50,
        linestyle_opts=opts.LineStyleOpts(curve=0.2),
        label_opts=opts.LabelOpts(is_show=False),
    )
    .set_global_opts(
        legend_opts=opts.LegendOpts(is_show=False),
        title_opts=opts.TitleOpts(title="Graph-微博转发关系图"),
    )
    .render("graph_weibo.html")
)
水球图,统计完成度,或者进度。

from pyecharts import options as opts
from pyecharts.charts import Liquid
from pyecharts.globals import SymbolType
c = (
    Liquid()
    .add("lq", [0.3, 0.7], is_outline_show=False, shape=SymbolType.DIAMOND)
    .set_global_opts(title_opts=opts.TitleOpts(title="Liquid-Shape-Diamond"))
    .render("liquid_shape_diamond")
)
让数据在3d地图上显示出来。
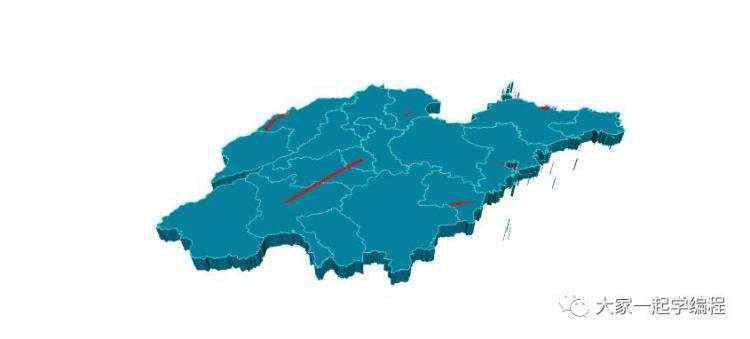
from pyecharts import options as opts
from pyecharts.charts import Map3D
from pyecharts.globals import ChartType
example_data = [
    [[119.107078, 36.70925, 1000], [116.587245, 35.415393, 1000]],
    [[117.000923, 36.675807], [120.355173, 36.082982]],
    [[118.047648, 36.814939], [118.66471, 37.434564]],
    [[121.391382, 37.539297], [119.107078, 36.70925]],
    [[116.587245, 35.415393], [122.116394, 37.509691]],
    [[119.461208, 35.428588], [118.326443, 35.065282]],
    [[116.307428, 37.453968], [115.469381, 35.246531]],
]
c = (
    Map3D()
    .add_schema(
        maptype="山东",
        itemstyle_opts=opts.ItemStyleOpts(
            color="rgb(5,101,123)",
            opacity=1,
            border_width=0.8,
            border_color="rgb(62,215,213)",
        ),
        light_opts=opts.Map3DLightOpts(
            main_color="#fff",
            main_intensity=1.2,
            is_main_shadow=False,
            main_alpha=55,
            main_beta=10,
            ambient_intensity=0.3,
        ),
        view_control_opts=opts.Map3DViewControlOpts(center=[-10, 0, 10]),
        post_effect_opts=opts.Map3DPostEffectOpts(is_enable=False),
    )
    .add(
        series_name="",
        data_pair=example_data,
        type_=ChartType.LINES3D,
        effect=opts.Lines3DEffectOpts(
            is_show=True,
            period=4,
            trail_width=3,
            trail_length=0.5,
            trail_color="#f00",
            trail_opacity=1,
        ),
        linestyle_opts=opts.LineStyleOpts(is_show=False, color="#fff", opacity=0),
    )
    .set_global_opts(title_opts=opts.TitleOpts(title="Map3D-Lines3D"))
    .render("map3d_with_lines3d.html")
)
饼图显示
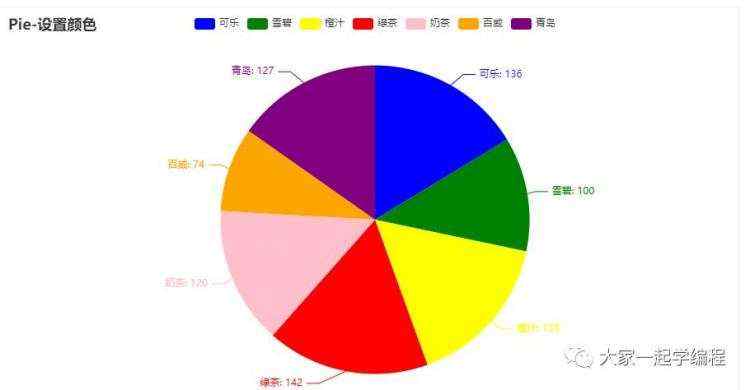
from pyecharts import options as opts
from pyecharts.charts import Pie
from pyecharts.faker import Faker
c = (
    Pie()
    .add("", [list(z) for z in zip(Faker.choose(), Faker.values())])
    .set_colors(["blue", "green", "yellow", "red", "pink", "orange", "purple"])
    .set_global_opts(title_opts=opts.TitleOpts(title="Pie-设置颜色"))
    .set_series_opts(label_opts=opts.LabelOpts(formatter="b: c"))
    .render("pie_set_color.html")
)
统计各项指标情况。
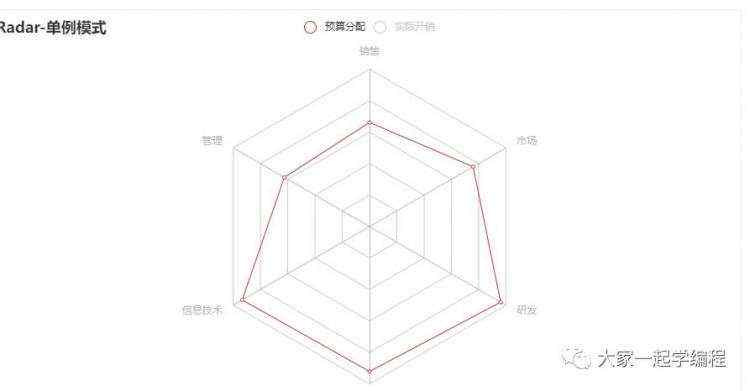
from pyecharts import options as opts
from pyecharts.charts import Radar
v1 = [[4300, 10000, 28000, 35000, 50000, 19000]]
v2 = [[5000, 14000, 28000, 31000, 42000, 21000]]
c = (
Radar()
.add_schema(
schema=[
opts.RadarIndicatorItem(name="销售", max_=6500),
opts.RadarIndicatorItem(name="管理", max_=16000),
opts.RadarIndicatorItem(name="信息技术", max_=30000),
opts.RadarIndicatorItem(name="客服", max_=38000),
opts.RadarIndicatorItem(name="研发", max_=52000),
opts.RadarIndicatorItem(name="市场", max_=25000),
]
)
.add("预算分配", v1)
.add("实际开销", v2)
.set_series_opts(label_opts=opts.LabelOpts(is_show=False))
.set_global_opts(
legend_opts=opts.LegendOpts(selected_mode="single"),
title_opts=opts.TitleOpts(title="Radar-单例模式"),
)
.render("radar_selected_mode.html")
)
树图,统计导向,思维。
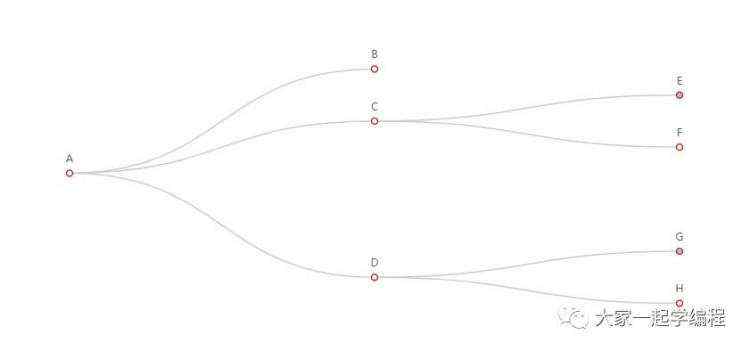
from pyecharts import options as opts
from pyecharts.charts import Tree
data = [

        "children": [
            "name": "B",

                "children": ["children": ["name": "I"], "name": "E", "name": "F"],
                "name": "C",
            ,

                "children": [
                    "children": ["name": "J", "name": "K"], "name": "G",
                    "name": "H",
                ],
                "name": "D",
            ,
        ],
        "name": "A",

]
c = (
    Tree()
    .add("", data)
    .set_global_opts(title_opts=opts.TitleOpts(title="Tree-基本示例"))
    .render("tree_base.html")
)
这是常用的几种数据分析统计图,不同的场景,应用不同的统计图,让数据看起来更简单,更方便分析市场导向,掌握先机。

 京公网安备 11010802041100号 | 京ICP备19059560号-4 | PHP1.CN 第一PHP社区 版权所有